Minor changes are by default collapsed in the page history.
No changes
The page does not exist yet.
Failed to load changes
Version by on
Leave Collaboration
Are you sure you want to leave the realtime collaboration and continue editing alone? The changes you save while editing alone will lead to merge conflicts with the changes auto-saved by the realtime editing session.
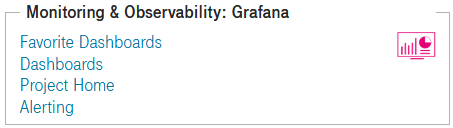
The DevOps Portal is now supporting auto-provisioning Grafana. Grafana is the leading open-source tool for monitoring and visualizing data from sources such as Prometheus, Loki, Databases, and more. It allows users to create interactive dashboards and set-up alerts to monitor application metrics as well as system performance and trends in real time. Grafana is rolled-out in May for all customers. You can add Grafana to any of your existing projects. This adds the Grafana tile to the Homepage of your project on the DevOps Portal. See Grafana concerning all details of the integration.
Improvements
Improved possibilities to support customers within their Portal.
Updated design to new T-Systems logo.
The regular expression used to validate email addresses is now stricter than before to spot impossible addresses earlier in the onboarding process of new users.